ngordnet: Semantic Evolution Explorer
Interactive tool fusing WordNet's semantic graph with Google Books NGram data to explore how language evolves. Query 'transportation' and watch centuries of linguistic change unfold.
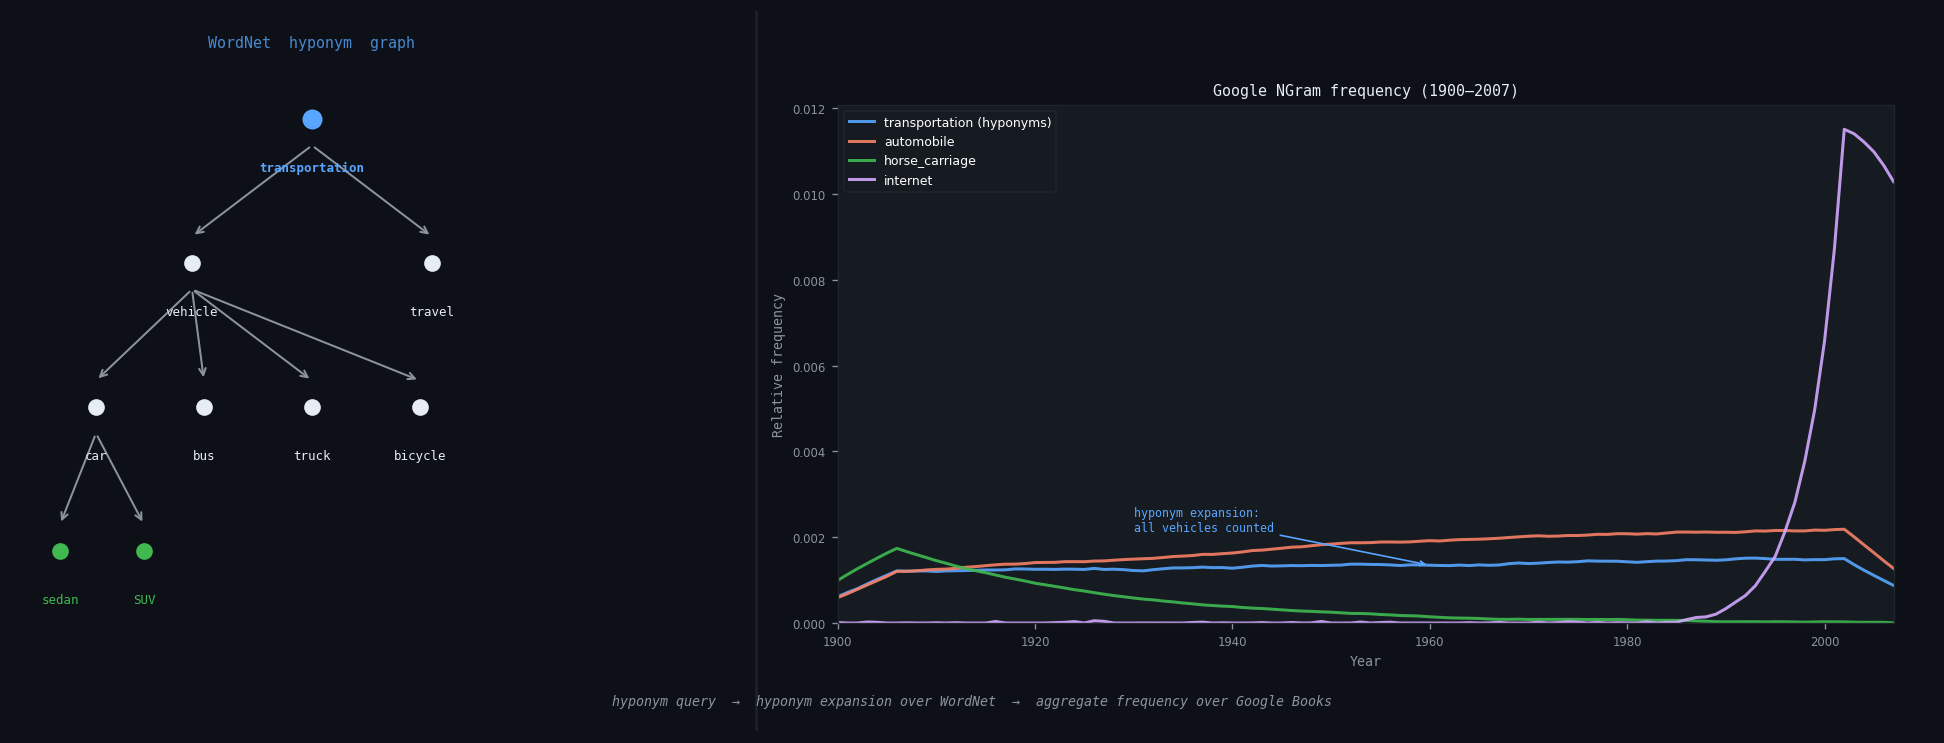
Query “transportation” and the tool expands it through WordNet’s semantic hierarchy to find every descendant concept (vehicle, automobile, bicycle, carriage, and hundreds more), then aggregates their Google Books frequencies across 200 years. The result is a single curve showing how the entire concept of transportation shifted over time, not just one word.
The Data Model
WordNet encodes the “is-a” hierarchy of English as a directed acyclic graph. Each node is a synset, a set of synonymous words expressing the same concept. Edges point from hyponym (specific) to hypernym (general): automobile → vehicle → conveyance → artifact → object. The graph has 155K synsets connected by ~166K hypernym edges.
The core challenge is that a single word can belong to multiple synsets (“dog” is both a domestic animal and a verb meaning to follow) and synsets can have multiple hypernyms (multiple inheritance). The in-memory representation maps word → Set<Integer synset_id> and maintains a separate synset_id → List<Integer child_ids> adjacency list for traversal. Both are built in a single pass over the WordNet files.
Google Books NGrams stores per-word frequency normalized by total corpus size in each year: (word, year) → count / total_words_that_year. This relative frequency makes 1850 and 2000 comparable despite the corpus growing 100×. The full dataset is 500GB; I load only the vocabulary present in WordNet, reducing the working set to ~200MB in heap.
Hyponym Expansion
The core query walks the DAG downward from a root word:
public Set<String> hyponyms(String word) {
    Set<Integer> visited = new HashSet<>();
    Queue<Integer> queue = new ArrayDeque<>();
    Set<String> result = new HashSet<>();

    for (int synset : wordToSynsets.getOrDefault(word, Set.of()))
        queue.add(synset);

    while (!queue.isEmpty()) {
        int s = queue.poll();
        if (!visited.add(s)) continue;
        result.addAll(synsetToWords.get(s));
        for (int child : children.getOrDefault(s, List.of()))
            queue.add(child);
    }
    return result;
}
BFS over the synset graph (not the word graph) handles multiple inheritance correctly. A synset visited by two paths is processed once. Typical queries return 50–500 words; “entity” returns ~40K, which is why depth-limiting matters for broad root concepts.
Frequency Aggregation
Once the hyponym set is computed, aggregate across time:
where is the NGram relative frequency of word in year . This lets a single query represent an entire semantic category. Querying “automobile” (one word) vs “vehicle” (all descendants) produces very different curves; the former tracks only the word “automobile” while the latter captures car, truck, van, bus, motorcycle, and dozens of regional variants.
What the Data Reveals
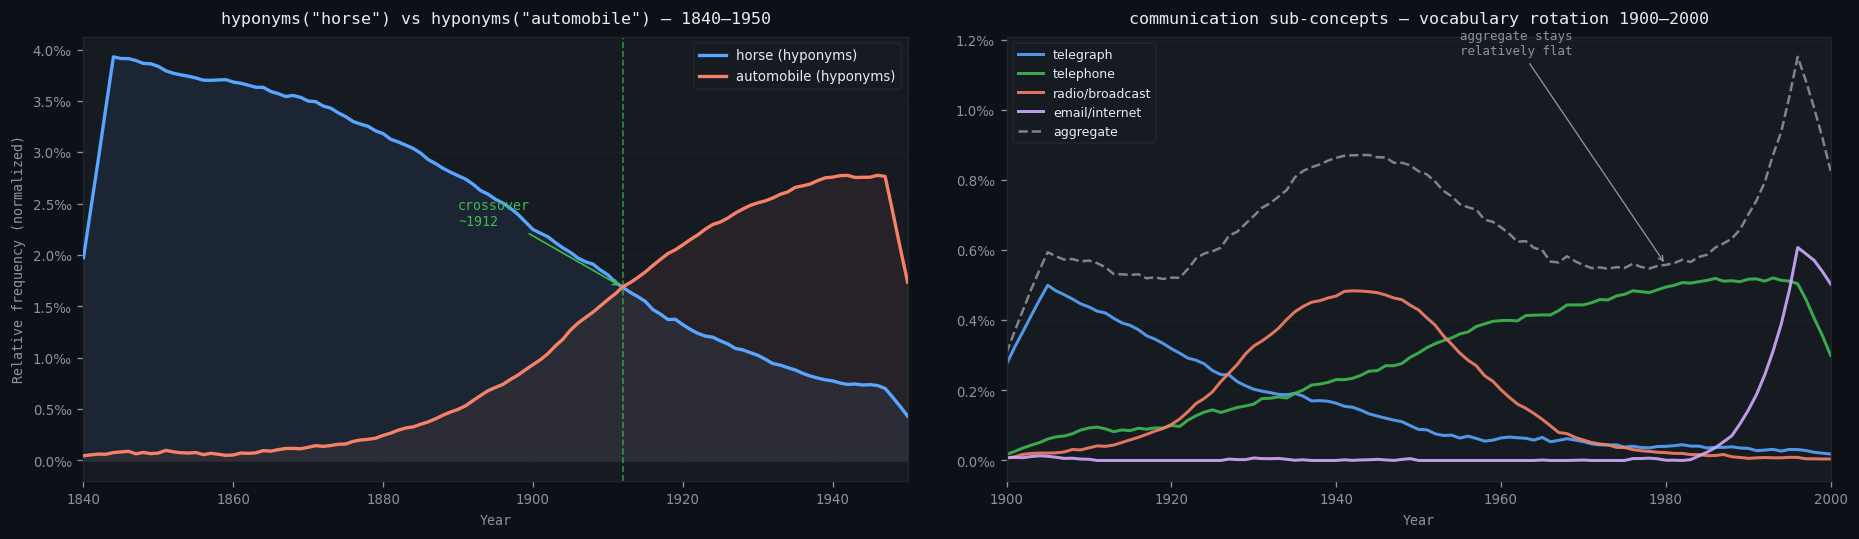
Left, “horse” vs “automobile” (1840–1950): The crossover happens around 1910, not the 1920s as popular history suggests. The NGram signal predates mass production because “automobile” entered the written record as speculation (patents, journal articles, newspaper coverage) before the cars themselves were common.
Right, “communication” hyponyms (1900–2000): Telegraph declines, telephone rises then plateaus, radio peaks around WWII, email/internet spikes after 1990. But the aggregate stays nearly flat throughout. The concept of “communication” didn’t grow; its vocabulary rotated. This is only visible when you query at the semantic level rather than tracking individual words.
Architecture
Java backend loads both datasets at startup (~3s), then serves queries over a lightweight HTTP server (Java’s built-in com.sun.net.httpserver). The /hyponyms endpoint returns the word set; /history returns a JSON time series for a word; /ngordnet combines both: expand then aggregate. Memoization on the hyponym traversal keeps repeated queries at ~1ms; cache misses take 20–50ms for typical depth queries.
The frontend is a provided browser interface that plots the time series returned by /ngordnet as a D3.js line chart. The interesting work is entirely in the backend: data loading, graph traversal, and aggregation.
Related projects
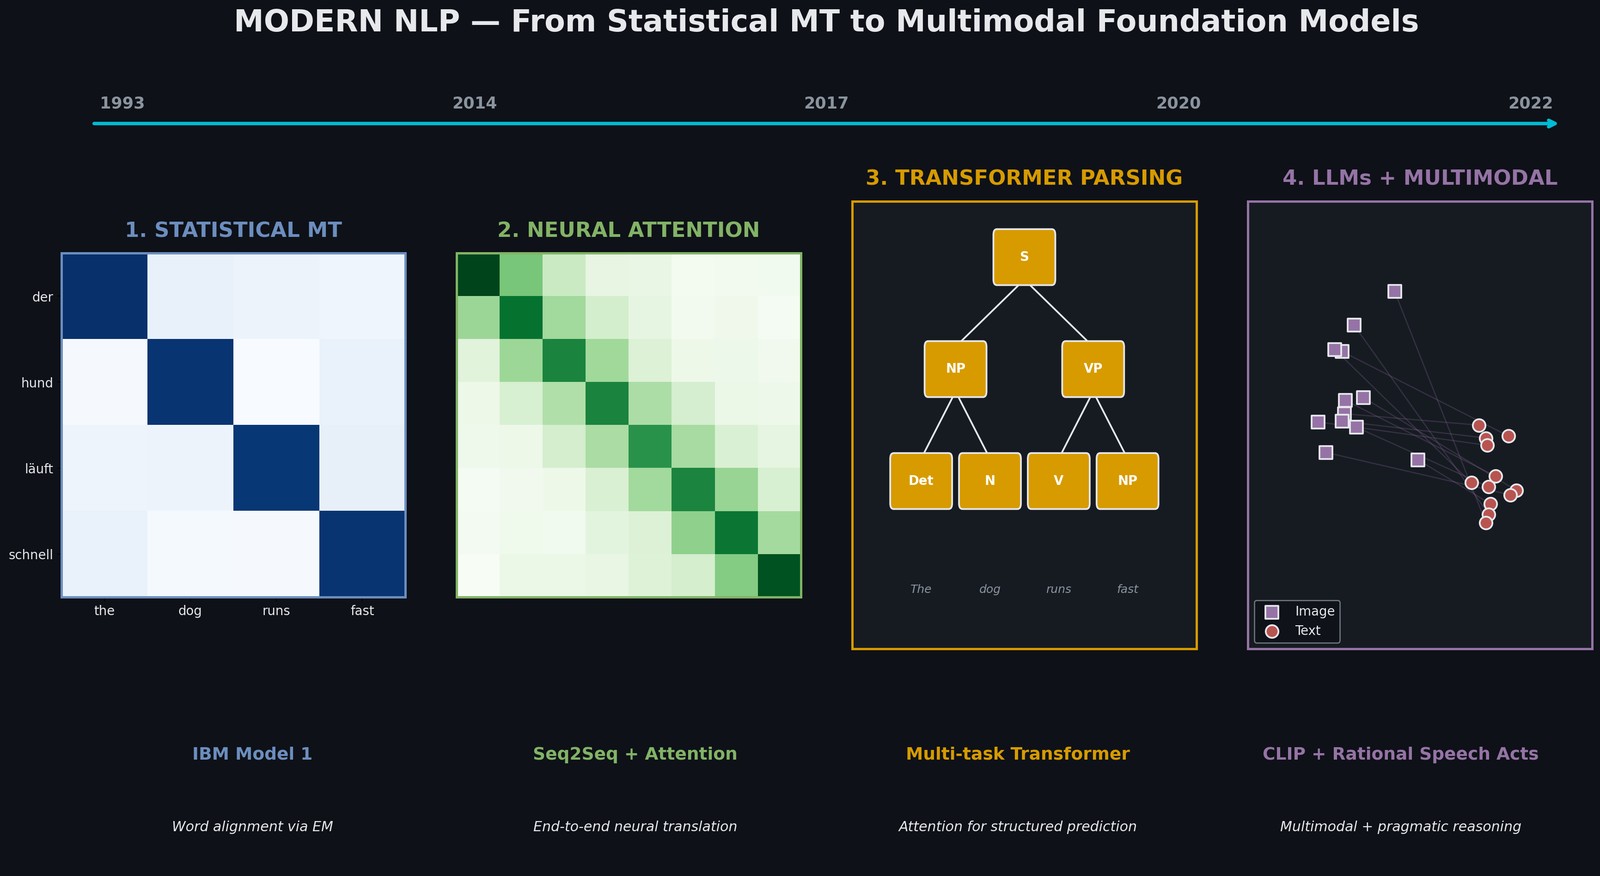
Modern NLP: From Statistical MT to Multimodal Foundation Models
Four paradigm shifts in one semester: IBM Model 1, attention-based NMT, transformer parsing, LLM fine-tuning, and CLIP multimodal retrieval with pragmatic reasoning. Each technique subsumes and extends the previous.
Build Your Own World
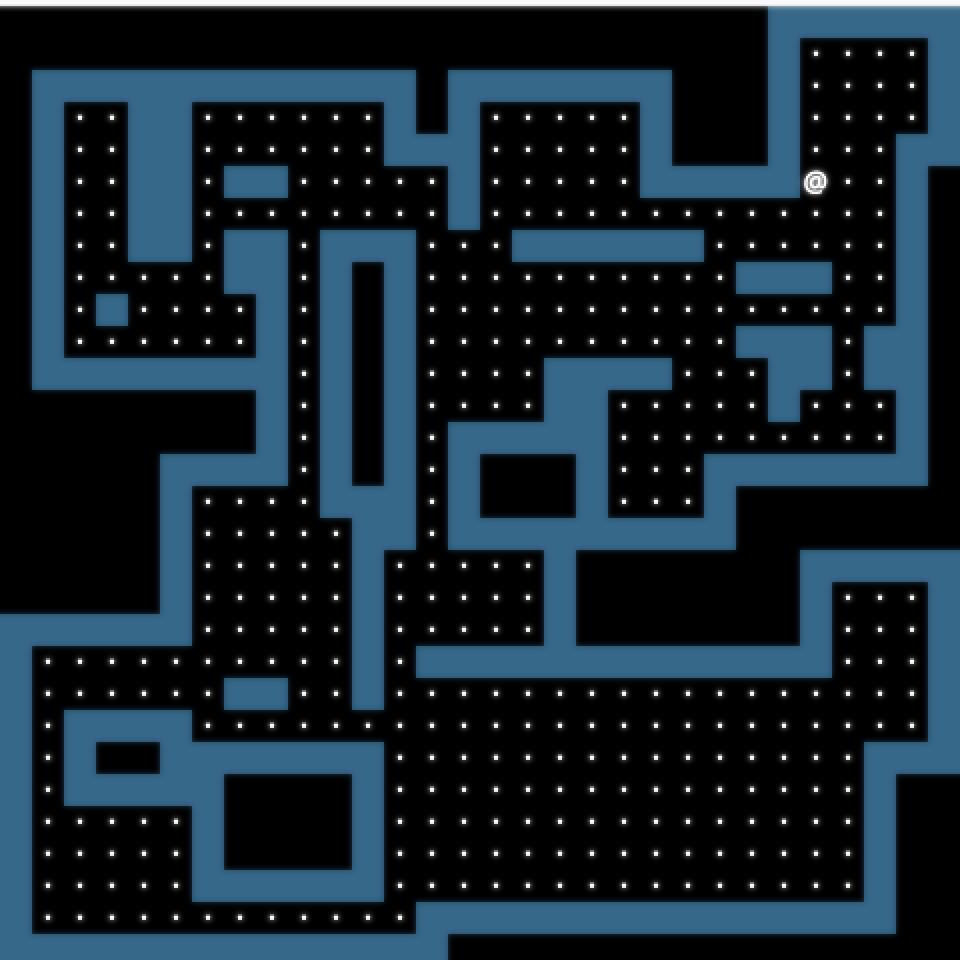
Procedurally generated tile-based dungeons with Dijkstra-routed hallways, circular line-of-sight, and deterministic save/load via seed replay. Written in Java from scratch.